


What a Month of Competitor Communication Reveals
In short
One month of LinkedIn posts from 33 competitors, read with a Marktradar, the four-page dossier from Picasi: three findings a marketing team takes from it, what each would mean in your market, and where it sits in the dossier. The example market is practice management software in Germany, September 2026.
The workspace follows 33 vendors of practice management software (PVS) for medical, dental and psychotherapy practices in Germany. For the dossier it was limited to LinkedIn company pages and to 31 days, 25 August to 24 September 2026. 21 vendors have such a page, 19 published during the period: 167 updates. Download the dossier as PDF (4 pages, 230 KB, in German).
What the month showed
Three findings a marketing team in this market takes from the four pages, each with the original one click away, and what each finding would mean in a different market:
- Four vendors played AI on the phone and in documentation in the same month, two of them through partners rather than their own development. The topic belongs to the market, not to one vendor. In your market this means: if a topic shows up at three or four competitors in the same month, it is no longer a one-off but a decision for your editorial plan, for it or deliberately against it.
- Four vendors advertised switching software within two weeks, three of them with a concrete offer: a price guarantee, an upgrade at the old price, free data migration. In your market this means: when several competitors aim offers at the same customer worry at the same time, your sales team should know before the next quarterly meeting, not after.
- A good third of all posts were about the company itself: jobs, anniversaries, company runs. In your market this means: subtract the employer share before you compare post counts, or a competitor that mainly advertises jobs looks loud. The share itself tells you what it uses the channel for.
How these findings come about, with evidence, the topic matrix and the limit of every statement, is in the full analysis on our topic website: The PVS market on LinkedIn, September 2026. It goes deeper into interpretation, with six observations and the limit of each one; this post stays with the dossier and shows where the findings sit in it.
Page 1: summary and four tiles
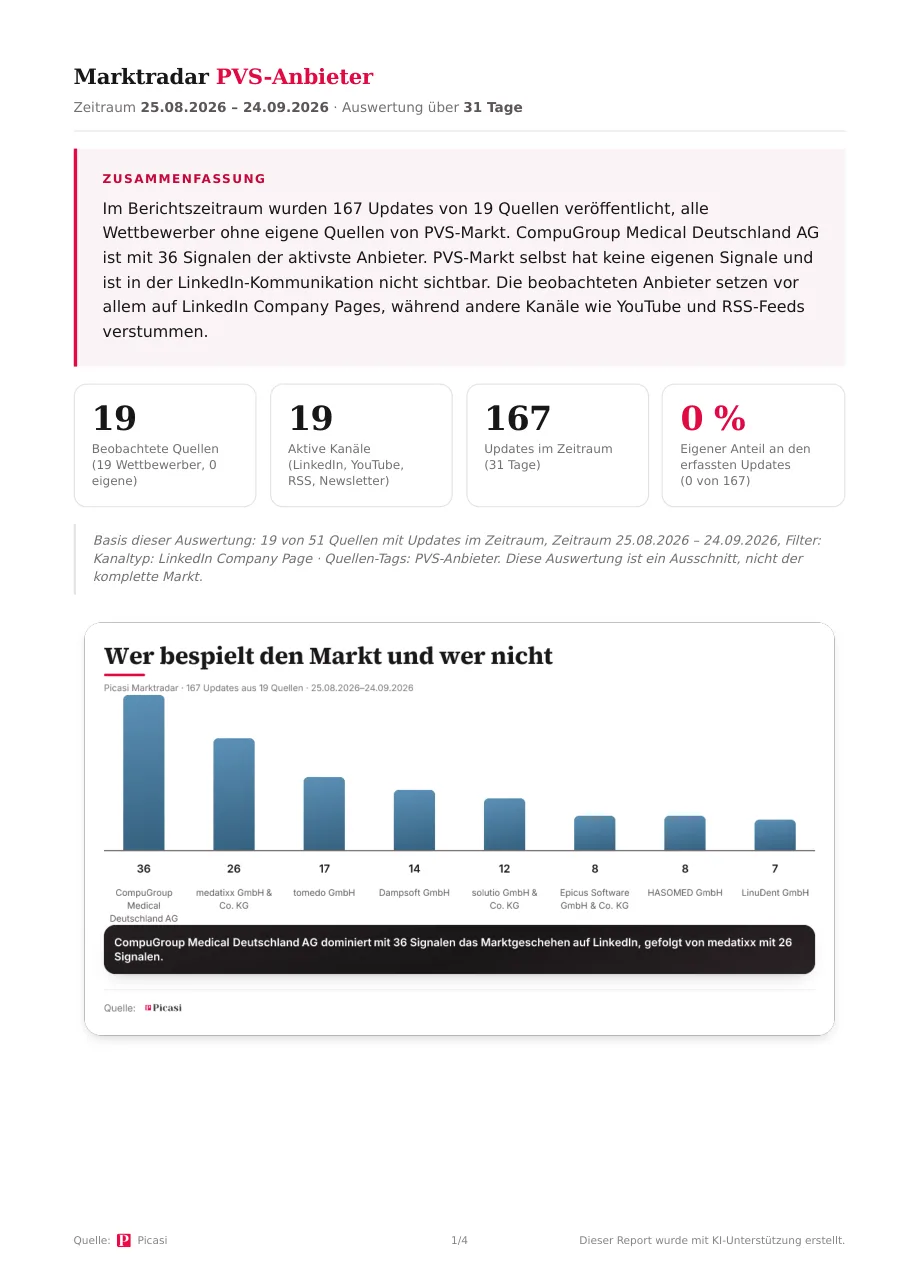
The summary names volume, loudest source and channel finding; it tells you whether turning the page is worth it. The tiles count sources with updates, active channels and the captured posts. Own share stands at 0% here because this workspace watches the market from the outside. In your workspace it is the most important tile: once your company is marked as your own source, it shows your share of everything the market said that month. The line “basis of this analysis” names period and filters; whoever passes the dossier on passes it along.
Page 2: which topics are growing, which are fading
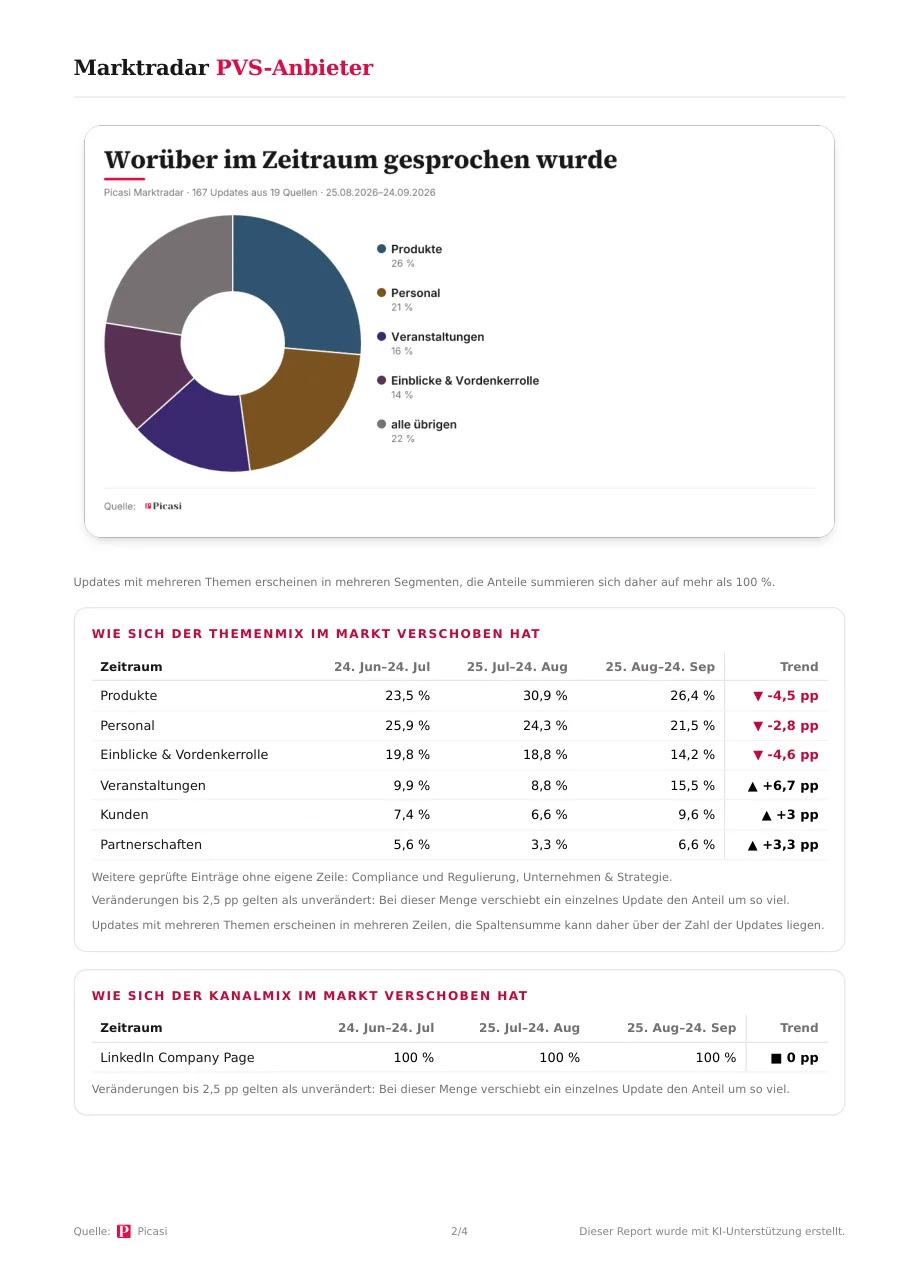
Every topic as a share of all updates, the current period next to the two before it. In the PVS market: Events from 9.9% to 15.5% (trade fair season), Insights and thought leadership from 19.8% to 14.2%, Products back to 26.4% after an interim high. An arrow appears only from 2.5 percentage points, because that is how much a single post shifts at this volume. That protects you from trends made of two posts. The channel mix shows 100% LinkedIn three times here because the dossier was filtered to it; without the filter it would show how the vendors spread across LinkedIn, YouTube, blog and newsletter.
Page 3: unoccupied topics and the posts that shaped the period
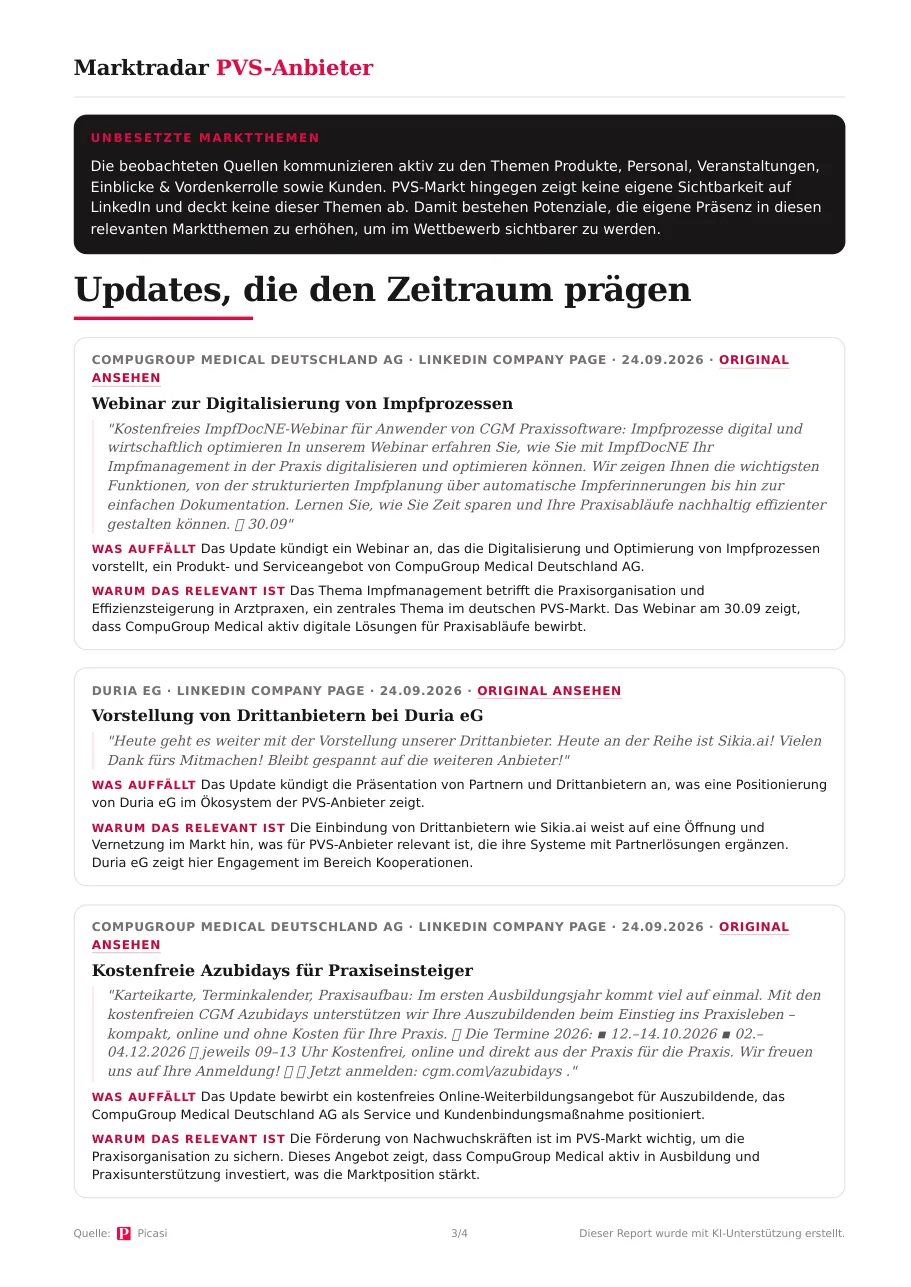
Unoccupied market topics compares the market's topics with yours: what several competitors occupy and you do not, and the other way round. Editorial plans come out of that. The defining updates come with a quote, “What stands out” and “Why it matters”; both are AI text, and the footer says so. Above them sits View original: one click, and the post from CompuGroup Medical or Duria is in front of you in the original. Why that is the touchstone of every AI analysis: Trust comes from the source.
Page 4: method and contact
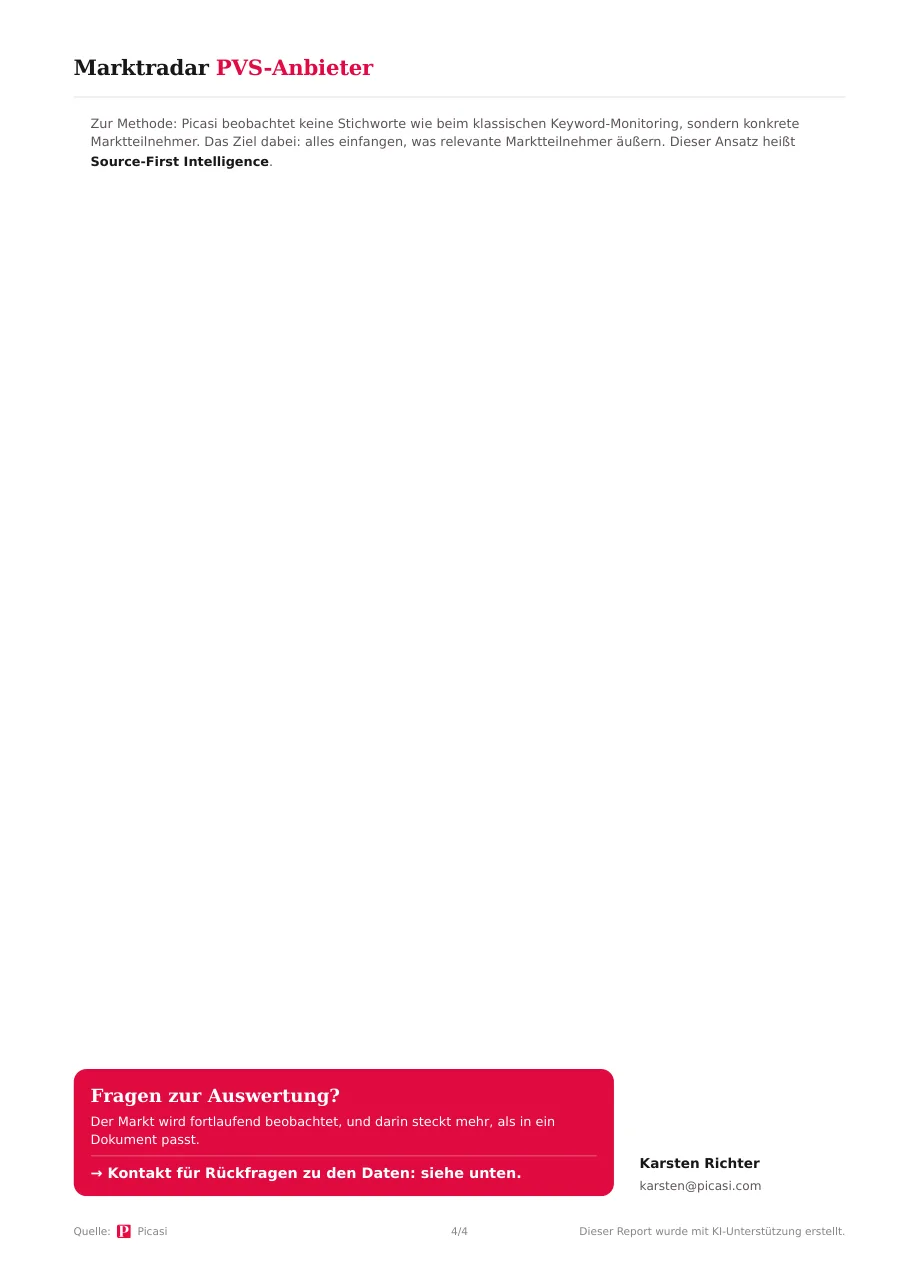
Three sentences on the method (market participants instead of keywords) and a contact for questions. Whoever passes the dossier on to management or an agency has the answer to “where do the numbers come from?” right there.
What the dossier is not
It counts publications, not effect: no reach, no revenue, no product quality, no third-party opinion. “36” at CompuGroup Medical means 36 posts on LinkedIn in 31 days, nothing more. And it is only as good as the list behind it. A channel with a wrong address delivers zero posts, and zero looks like silence; exactly that happened to us during setup with one vendor that stood at 17 posts after the correction. Check your list before you believe the dossier.
From reading to routine
The Marktradar earns its value through repetition: page 2 compares three periods anyway, and from the second dossier on you follow your own share across the months. What separates dossiers from reports is at Reports and dossiers; the monthly comparison of your communication with the market is described by the Monthly Market Report. You can try Picasi for free, no credit card required.
Frequently asked questions
See also
- AI Competitive Intelligence: Trust Comes From the Source – the click to the original as the touchstone
- LinkedIn Company Page Monitoring – the channel this dossier is limited to
- Source-First vs. Platform-First – why one channel is never the whole market