


Picasi Feature
The Matrix: your market's communication patterns at a glance
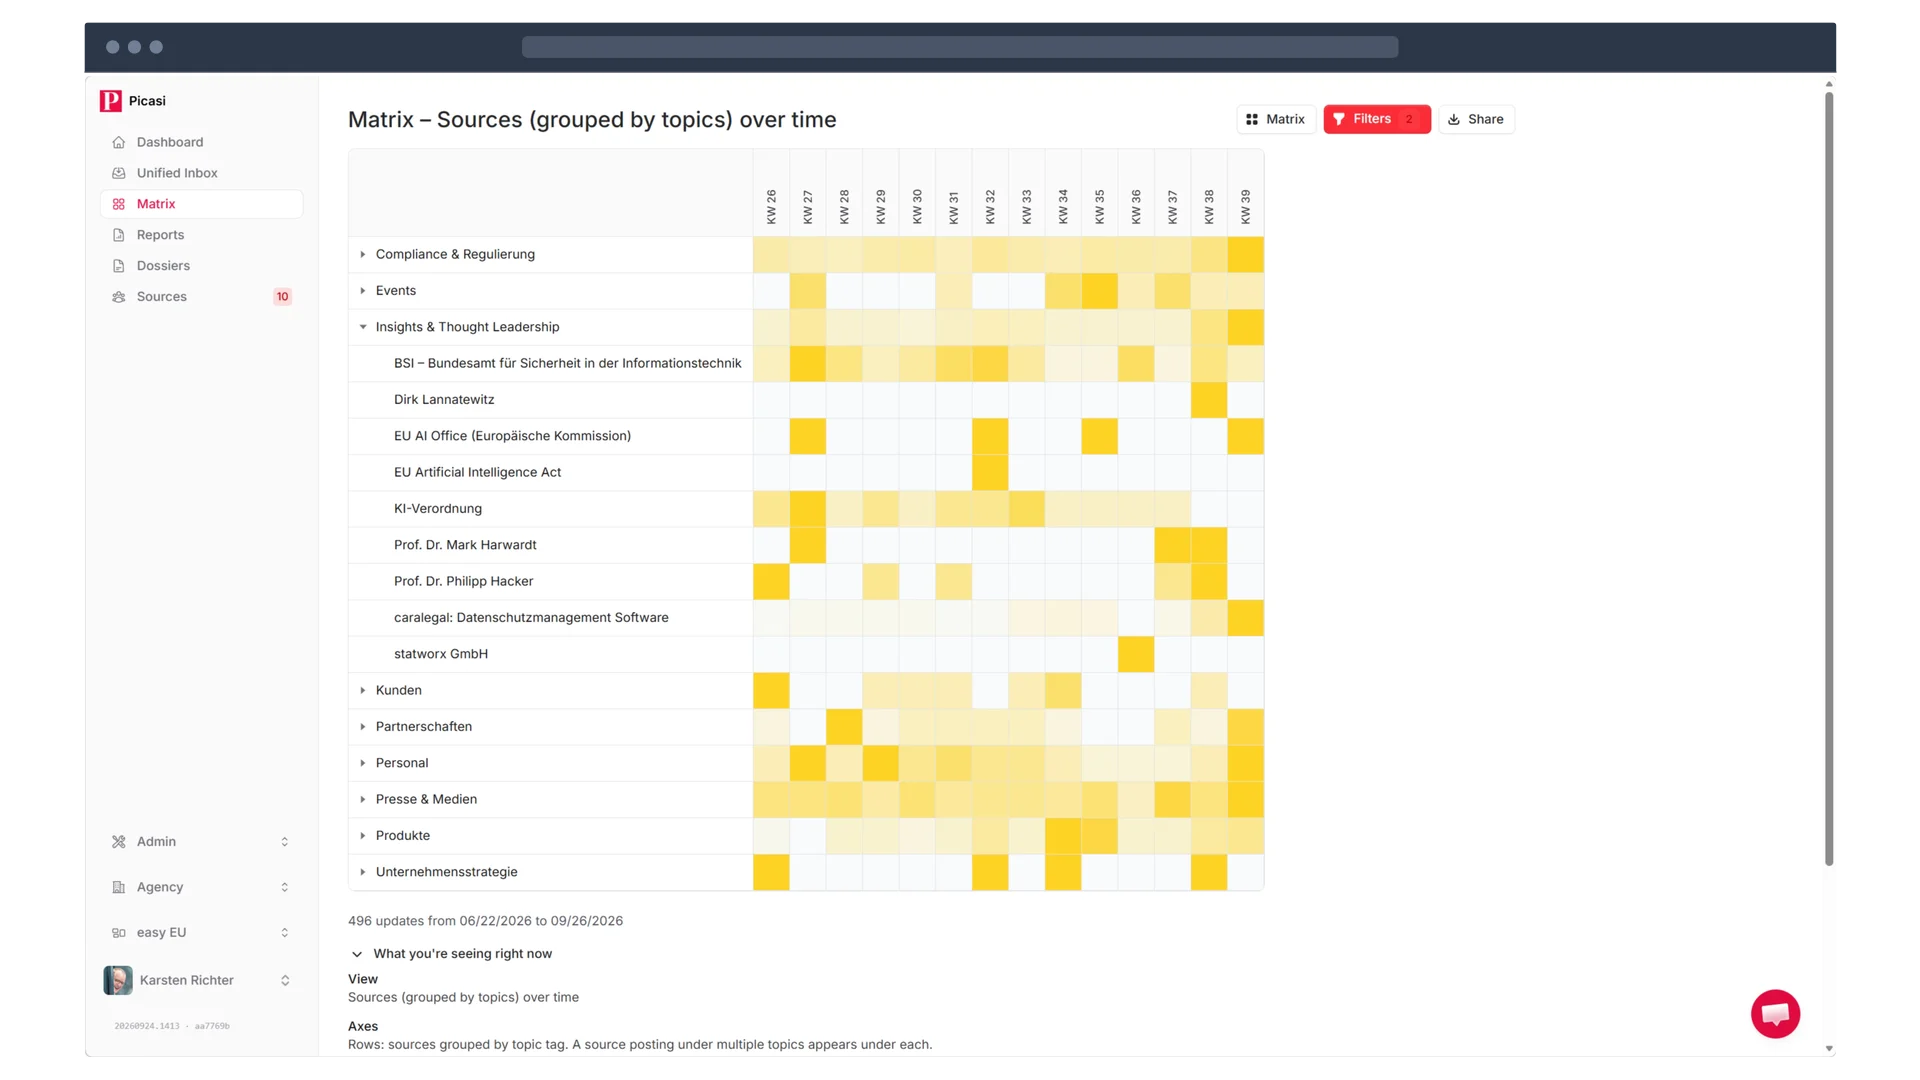
The Matrix is Picasi's comparison view for market communication: it lines up your monitored sources in rows against time periods or topics in columns. You see patterns – who communicates how often, about what, on which channels – instead of reading hundreds of individual updates. No forecasts, no AI scoring: only verifiable communication data.
Which problem does the Matrix solve?
Your Unified Inbox collects every single update – that's the chronology. But strategic questions are comparison questions: Does competitor A post more often than B? Is a trade publication's topic mix shifting? Which channel carries whose communication? Patterns like these are invisible in a chronological list.
That's exactly what the Matrix is for: it condenses the same updates into a table of sources and time periods or topics. Conspicuous cells – sudden activity spikes, sources going quiet, new topic areas – stand out immediately, and every value stays traceable down to the individual update.
What can the Matrix do, concretely?
- 9 view presets cover recurring questions – from the activity overview to the topic comparison, switched with one click.
- 6 metric modes determine what the cells show – for example the number of updates or their distribution across channels and tags.
- You choose the observation window and the resolution of the columns yourself – for a short-term campaign check as well as the quarterly review.
- Sources, channels, and tags can be combined; the Matrix always shows exactly the slice of your market you need right now.
- Every number is based on the updates actually collected from your sources – nothing is estimated or extrapolated.
What does the Matrix deliberately not do?
The Matrix makes no forecasts and assigns no AI scores. It answers the question "What actually happened?" – not "What will happen?" or "Is this good or bad?". This separation is intentional: interpretation and recommendations come from the reports; the Matrix remains the neutral, always verifiable factual base your team can agree on.
And it only shows what your curated source base contains: a source you don't monitor never appears in any cell. That's the Source-First approach – Track who, not what: signal instead of noise, because you choose your sources deliberately.
What do marketing teams use the Matrix for?
Compare competitor activity
Who ramped up communication last month, who went quiet? One look at the rows tells you – including the channels where it happened.
Spot topic shifts early
When several sources start covering the same new topic, individual mentions become a pattern – visible before the topic reaches the established search terms.
Prepare the monthly report
The Matrix delivers the numbers for management updates: verifiable activity data instead of gut feeling – and the reports turn it into the written summary.
✓ First 300 updates free · ✓ Set up in 5 minutes · ✓ No credit card required
Frequently asked questions about the Matrix
See your market's communication as a pattern, not a list
Try Picasi with 300 free updates – Matrix included, no credit card required.